Realize the power of your data for the citizens you serve!
The NDIT Data Science and Analytics team provides data science and advanced analytic service to assist you on your journey of navigating the new data normal.

Move Towards Analytic Maturity
Data maturity provides greater insight, improves operations, and helps Team ND more effectively serve the citizens of North Dakota. A strong analytics practice can improve service quality and decision making. Wherever you are on your data journey, the Data Science and Analytics (DSA) team can help you leverage your data in a powerful way to unlock new insights and innovations. With the DSA Team's knowledge around data science and advanced analytics, you can explore the utility of your existing data to maximize use, identify and problem solve any existing gaps, and facilitate data practice that allows you to turn ideas into reality.
Increase the Power of your Team
The DSA team provides objective peer support to your staff so they can gain confidence while developing a deeper understanding of new methods and tools. Additionally, DSA can hep refine your existing practice so that your analysts can answer more complex questions. We can help your team streamline existing data processes and create analytic models to reduce the time needed for manual maintenance. The DSA Team can help you give your subject mater experts the support they need to drive innovation and soar to new data-driven heights.
Services
Gain a factual understanding of data (regarding citizens served, services, programs, etc.), based on existing information or on external information that can be accessed. The DSA Team can provide descriptive analysis including:
- Mean, median, and mode
- Rates, ratios, proportions, and demographic analysis
- Patterns in data over time (trend analysis)
*Example 1: Preparing summaries for legislative testimony of complex data for meaningful and informative presentation. How has the client base grown over time? What are your busy seasons?
*Example 2: A monthly summary of programs and services provided, and key outcome measures to help track performance consistently and providing the team with everyday insight into the factors affecting the business.
Work with customers to understand and analyze data to determine significant predictors for a specific situation, help determine whether a change in policy or program had a measurable effect, or explore what may happen in the future based on the trends from historical data.
*Example 1: Use of statistical models like regression to show how attendance rates in school and standardized test results can predict the likelihood of a student dropping out of high school before earning a diploma.
*Example 2: Use Machine Learning techniques to predict possible future patterns, such as the likely spread of a disease based on historical trends and testing numbers.
Assist in developing, administering, and supporting several different survey types while working with customers to utilize optimal survey administration methods. The team can analyze the survey data as a stand-alone data set or integrate the data with information the customer may have collected previously.
*Example: In a poll of staff or clients to determine the effectiveness of the service, DSA can assist in writing questions, determine method of delivery that helps collect unbiased answers, and create a plan for interpreting results.
The DSA Team can help determine the method of collection and size of the sample necessary to ensure that the customer gets meaningful results (i.e., methodologically valid sample selection). The team can determine the appropriate sample size, and provide the technical documentation associated with the sampling process, as well as pull the data for the review and conduct the analysis.
*Example: Developing methods to collect a sample that is appropriately sized for significance testing in a federally required Quality Control process.
The DSA Team can assist customers in identifying the best way to visualize and present data in a meaningful and actionable way. This can include summarizing data in a table, graph, heat map, or other visualization to gain insight from your data and help tell the data story.
*Example: Designing effective visuals for use in federal and public reports or legislative testimony.
With Data Exploration (e.g., “Slice & Dice,” “Data Manipulation,” “Data Mining,” and “Data Transformation”), the DSA Team can reorganize and restructure customers’ data, allowing the ability to look at it in a more effective way to discover what is possible with your data.
*Example 1: Data is spread across multiple files that are difficult to merge (Identifiers don’t match perfectly)
*Example 2: Clients are represented in various columns and need to be transformed to be summarized in a single list
*Example 3: A series of complex filters are needed to get to the data that is really of interest
*Example 4: Determining if the data is appropriate for more complex analysis
Review customers’ existing data analysis processes and identify data efficiency improvements as well automation opportunities. This type of automation promotes a shift toward self-service, reduced manual effort, and quicker results.
*Example: Reimagining an existing data analysis project (for example, in Excel) that takes significant time to manually complete, but the work is clearly defined by rules and policy. DSA can evaluate if the project can be rebuilt in a program like Power BI, Python, Cognos or one of the many tools the state has, in order to free up all manual time and effort by staff.
From the start of a project, the DSA Team can assist in identifying analytic problems and defining measurable goals. This scientifically sound approach will ensure collection of the data needed to effectively make data driven decisions. The DSA Team can perform an objective interpretation of existing data/information to determine if it can provide measurable value for a current project/initiative.
*Example 1: When department leadership create an initiative to transform their services, DSA can help staff plan for collecting data to track the progress and help build a process that will allow measurement of the effectiveness of these changes.
*Example 2: A new federal requirement is asking for a survey of customers to evaluate client satisfaction with services. DSA can assist in determining what questions existing data can answer, help design a customer survey to fill in the gaps, and a plan for how the survey responses will be evaluated.
Real World Examples
The Department of Human Services' Division of Child and Family Services (CFS)
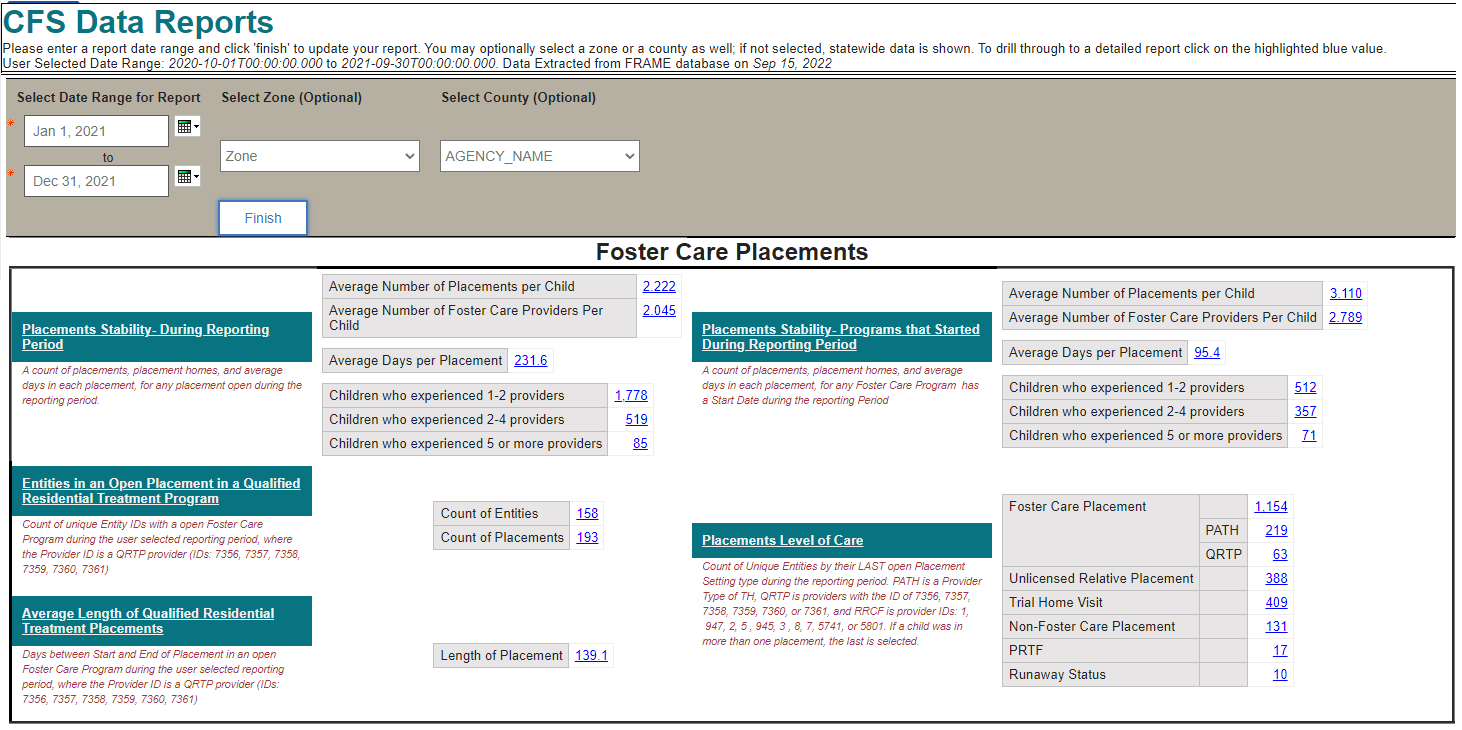
The Department of Human Services’ Division of Child and Family Services (CFS) provides critical and complex services to North Dakota families in need. To help CFS track a wide variety of important indicators, DSA built a self-service dashboard that allows staff to check over 50 different essential data points for any desired date range needed. This dashboard provides the ability to select values to further break down details such as county subtotals, age groups, and client counts. Organizing dozens of reports into a central location through this project greatly enhanced staff ability to access important data points.

✔On-Demand Access to Statistics
✔ Central Location
✔ Run Any Custom Time Period
Complex Data Merge for SNAP and DPI
During the COVID-19 pandemic, the Department of Human Services’ Supplemental Nutrition Assistance Program (SNAP) and the Department of Public Instruction collaborated to distribute funds for the COVID-19 Free Lunch Program to families whose children were participating in distance learning at home. The data were not formatted in a way that allowed them to be easily combined. Names and addresses were often typed differently, and these systems did not share identifying numeric values, such as a client ID or social security number. DSA used data cleaning methodology and “fuzzy word matching” techniques to provide a list of likely row matches which program staff reviewed and approved, saving hundreds of hours of manual work.
Example: Jane Doe -123 Main Street, Fargo ---> Jan E. Doe - 123 Main St., Fargo
While neither the name nor the address is an exact match in the example above, the possibility of the name being mistyped (Jane = Jan E.) and the address being the same (Street = St) could be flagged as a likely match for staff to review and approve. Using this new process, staff no longer had to manually sort hundreds of thousands of rows in Excel trying to visually compare files between screens, while still allowing for careful human review of the data.
✔ Saved Hundreds of Hours of Staff Effort
✔ Merged Data with Machine Learning Techniques
✔ Reduced Human Errors
Social Network Diagram to Assist COVID-19 Contact Tracing
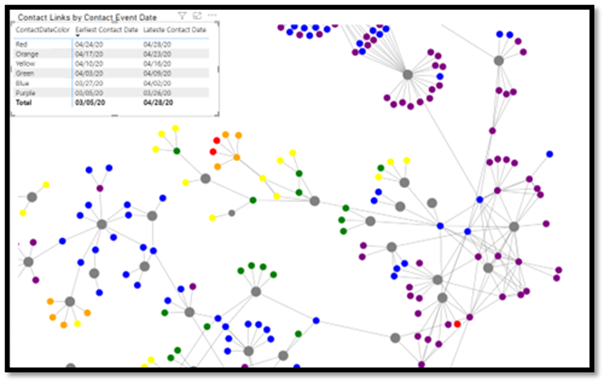
To assist with the early understanding of how COVID-19 spread in populations, DSA provided a social network diagram to visualize the spread of COVID-19 through contacts to new populations over the first few months of the pandemic.
The interactive Power BI diagram illustrated the spread of COVID-19 cases over time between family, friends, coworkers, and other close contacts. Older cases were represented by the cool colors of blue and purple, and progressively newer cases were represented by orange, yellow, and red. This visualization was used by the Unified Command Information & Intelligence (I&I) Team.

✔ Visualization of Relational Data
✔ Intuitive Heat-Related Colors Represent Cases Over Time
✔ On-Demand Access to Assist Decision Making
Interpreting English Learners Testing Scores
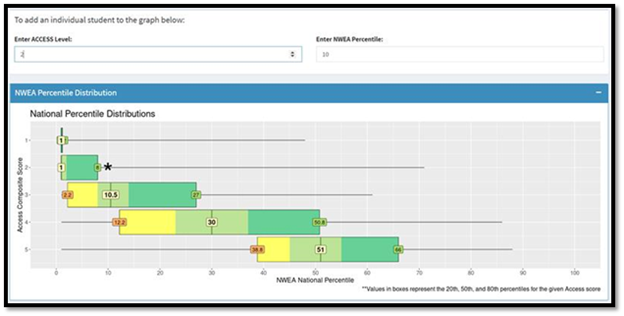
DSA created a public dashboard designed to help teachers and parents interpret test scores for English Learners (EL) to determine how well they score compared with students at a similar English proficiency level. It can be difficult to interpret test results for these students since it is often unclear whether they are struggling with the test material itself or are merely unfamiliar with the language.
In the example illustrated below, a student at an emerging level of English Proficiency (level 2 of 5, still very much learning the language) scored in the 10th percentile on the NWEA standardized test, meaning that 90% of all students scored better than this particular student. For a student who is a native English speaker, this would not be a particularly good score, but when this student’s score is presented alongside peers with a similar English proficiency level, we see that he is actually scoring rather well. This may lead teachers and administrators to the conclusion that the student is performing well academically, but simply needs to improve his proficiency in English.
This web application also allows EL teachers to create customized PDFs with student-specific test data across a multitude of assessments with scores compared to other students at the comparable level of English knowledge. These results have been used to compare student progress year over year and stored in student files for review by school staff and teachers.

✔ Statistical Analysis to Enhance Score Interpretation
✔ Better Understanding of Disadvantaged Students
✔ On-Demand Access for Teacher Needs
COVID Rt Live County-Level Model
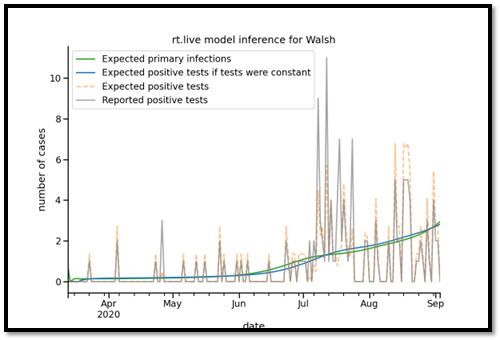
Use of predictive models to aid in planning was essential during the COVID-19 pandemic. DSA assisted the Department of Health in adapting an open-source nationwide model to predict COVID-19 trends in individual North Dakota counties, helping to determine when each unique region would need assistance most. DSA assisted in evaluation of the model to determine if it was appropriate for our rural populations, adapted the open-source code, and optimized it to run more efficiently. The model was used by the North Dakota Department of Health as part of the Smart Restart decision criteria in determining when restrictions could be safely reduced.

